The following study is performed by me, utilizing the data from RBI website. The data used for Balance sheet and P&L are old (as of March 2014), but the Price to book value data is taken as of February 2015.
OBJECTIVE
The purpose of this study is to quantitatively identify the impact of Quality of assets and the ability to manage it, on the Market performance.
HYPOTHESIS TO BE TESTED
- Higher the GNPA as a percent of advances, Poorer is the market performance
- Higher the GNPA, banks provide higher provisioning
- Higher provisioning leads to poor market capitalization
- Private banks have better assets than public sector banks
- Lower NPAs leads to better market performance
OBSERVATIONS
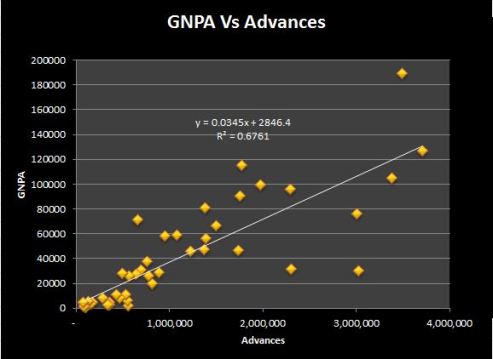
For every 1 rupee of loan advanced, a bank can expect on an average, 3% (from the chart) of it would become non-performing asset
- Average NPAs carried by the banks in the country is 3.9% which validates the above fact
- SBI is the leading provider of advances, with ICICI coming second
- Of the total Loans disbursed, Public Sector bank disburse 44%, followed by Nationalized banks
- State bank group is worst at managing their loans (refer pie chart)
- Private sector bank’s contribution towards NPAs is the lowest (indicates why people favor private banks) ( would be observed as we proceed)
NPA & MARKET PERFORMANCE
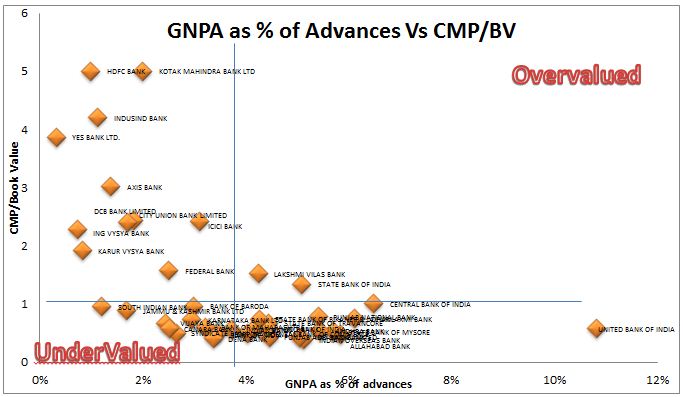
As the % of Non performing assets increase, the financial performance of the banks suffers, as it invokes interest loss and capital loss. Interest loss affects the profitability and capital loss affecting the balance sheet. Hence, higher is the NPA, poorer is the operational characteristics of the banks, which should result in the poorer market performance. Since this is a plot for just one particular year, the future movements in NPA would determine the variations in value for the banks.
- United bank of India fares poorer in terms of the NPA, as almost 11 rupees out of 100 lent would become GNPA for this bank. It trades at significant discount to the book value.
- Yes bank has the lowest GNPA amongst all the banks and trades at nearly 4 times book value. A significant premium indicates the amount of confidence public has on this bank.
- HDFC Bank and Kotak Mahindra are performing excellently in the market trading at around 5 times the book value, as their GNPAs are also lesser than 2%
- Many banks are falling in the line of Under valuation, though they have lesser NPAs, they trade at a discount to the book value. Some names we can decipher are South Indian Bank, Jammu Kashmir Bank, Canara, Vijaya and Syndicate bank
- Fortunately we see no overvalued banks in the chart
- Some further studies can be warranted from this chart are,
- Large and smaller banks
- Higher NPA and Lower NPA performers
- Public sector Vs Private Sector
- Whether NPAs are the only reason for poor performance?
STUDY 1: LARGE BANKS VS SMALLER BANKS
10 LARGE BANKS (Classified based on the assets)
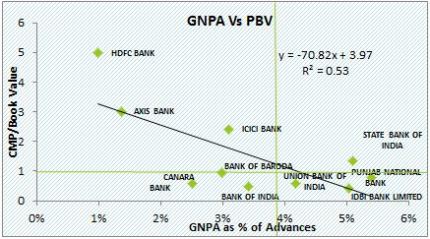
The lowest NPAs should indicate better performance of the bank financially and in the market. Accordingly, HDFC and Axis bank are performing excellently well, having the least NPAs. Canara bank, BoB and ICICI form the next three banks having lower NPAs, but, except for ICICI, both Canara bank and BoB are trading below or near the book value. These two banks need to be studied better to understand their underperformance. Among the top 10 banks, IDBI, PNB and SBI are the lowest in terms of asset quality, possessing above 5% as GNPA. SBI indicates the confidence people have over the bank, though having poor asset quality among the larger banks, trades at a premium to market value. Many questions can arise just out of this chart. Can a simple correlation between NPA and Market performance would throw us insights on which are better banks to invest in? How can one be sure that no other factors affect the banks? We will address these questions in subsequent studies.
If I have to explain the answers for the questions, the trend line indicates the banks which have higher NPAs are faring poorly in the market. It is a very logical thing too. But we need to understand the trend of each bank’s NPA in the recent past also to make a better judgment. Since RBI provides no such data, I am limiting my analysis to what I know and what is available.
Based on the above chart, if one has to think about investing, one needs to be cautious about investing in PNB, IDBI, SBI than in HDFC, Axis provided the asset quality remains the same. One can explore the banks like Canara and BoB to understand whether value exists.
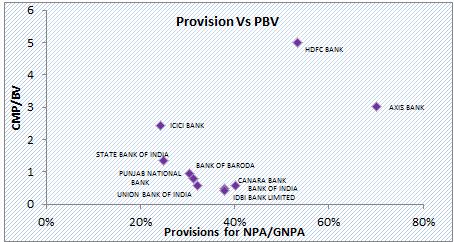
Average level of provisioning in the whole Indian banking system is around 30%, hence anything above this limit can be mentioned as good. Higher the provisions for the NPAs, the profits would be lesser indicating the banks would perform poorly in the market. But in future the need for additional provisions is reduced, which enhances future profitability, hence market performance. Also higher provisions indicate the banks being more conservative and represent true facts on the loans which are NPAs. In future, the benefits are two-fold for a bank which provides higher provisioning. In case of NPA rise, they have already shown higher provisions, hence the reduction in profits in future would not be that high. In case an NPA starts generating value again, the provisions would decrease, resulting in enhanced profits for the future. In such a scenario, HDFC and Axis (Lowest NPA banks remember?) provides the highest provisioning, hence higher market share. This could be the reason for the euphoria over the HDFC and Axis bank, where every analyst seems to be bullish about these two banks.
Let us go back to our Canara bank and BoB where we said, there is some value existing. Canara bank provides better provisioning than BoB. Canara Banks’ under performance is still confounding. If they have one of the lowest NPA levels and with higher provisioning, this bank can be called as conservative enough, yet it trades at significant discount to market value. Let us look at different picture then.
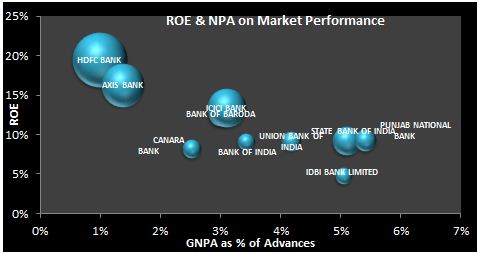
All I have been talking about is the asset side. But a bank, which manages the quality assets, to enhance its performance would be measured by the return it generates. Hence bringing in ROE in this picture, the chart is given below. Higher ROE and Lesser NPAs constitute a best bank! And the same story unfolds here, as you see HDFC and Axis scores here. Whenever an analyst mentions choose private sector banks, especially HDFC and Axis, you now know the reason why. Bubble Size indicates the bank’s Price to Book value ratio. Biggest bubble is of size 5!
Canara bank, the return it generates on the assets, even with lesser NPA is not commendable, which results in poorer market performance. This answer almost as many doubts we had in the above paras. They are enhancing business at the cost of profitability is one thing which I can infer.
From the above, BOB again becomes attractive with almost 12-13% ROE, lesser NPAs, moderate provisioning, trading at 0.96 times book value! If one has to consider 10% ROE at least as a satisfactory measure of bank’s performance, only 4 banks stand out, and it can be visibly seen in the chart.
Favored Banks – HDFC, Axis, ICICI
Value – BoB, Canara
Never venture – PNB, IDBI, even SBI (but since this is the largest bank, one can to consider at lesser multiples)
10 SMALLER BANKS (Classified based on the assets)
Lets get to the point straight. Those who think of venturing into LVB exercise caution. CUB, DCB , ING Vysya and KVB are better banks among the smaller banks. KVB is relatively very safe to venture into, as they have higher provisions and lesser NPAs. As long as the slippage don’t go out of hand, it is an excellent bank. Almost all the smaller banks which trades at premium valuations, have better asset quality and truer picture by providing higher provisions. We would look at how these banks trade with respect to ROE too.
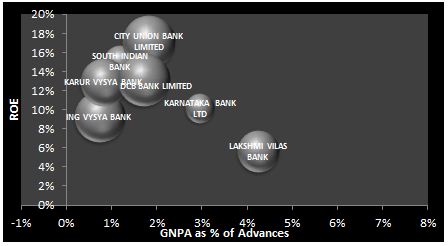
Needless to say, all the top performers have been the ones which are also generating higher ROEs. Surprisingly South Indian bank has an ROE of 16%, GNPA of just 1.5% and trades at 1 times book value! Is this the reason why this stock has been favored by Value investors?
Banks favored – City union, KVB, DCB, ING Vysya
Value – South Indian
Never venture – Laxmi Vilas, Dhanalakshmi
Study to continue…..
